og.m
ng.m
see also Matlab plot formats and how to quickly save high quality figures for hgx, a function to handle exporting figures.
The new graphics system in Matlab 2014b has a few handy features, including:
- Perceptually-equally spaced default colours (although be careful, red is near green)
- OpenGL hardware rendering - smooth lines!
- Easier access to handle properties using structure syntax - eg. handle.FontSize = 12, instead of set(handle, 'FontSize', 12).
Even so, it still takes a little bit of effort to render nice figures and graph in Matlab, the default settings don't look great. Generally lines need to be made thicker, fonts bigger, etc., etc. Each setting requiring a line of code. Also, OpenGL can be a bit unreliable; it switches to software rendering on a whim, which disables features like anti-aliasing.
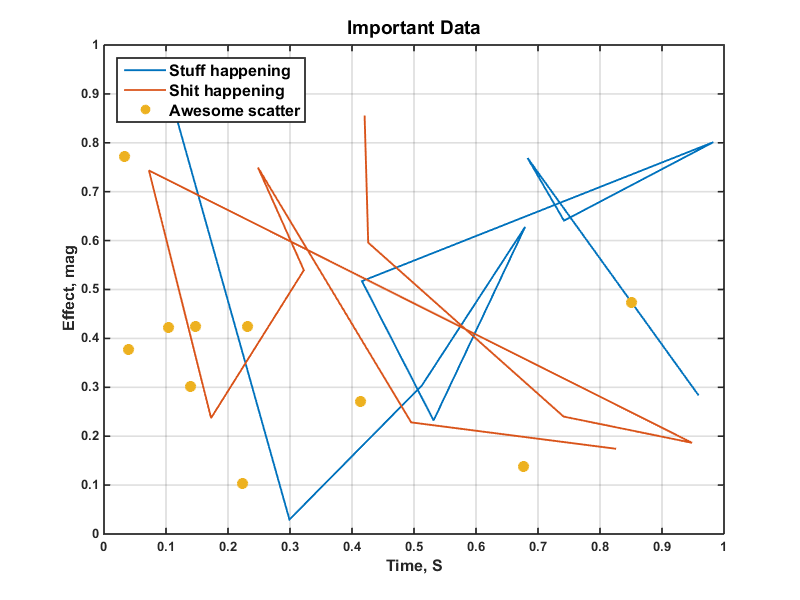
This is where these two functions come in. They convert multiple lines of faffing required for each figure in to two characters. og deals with making sure OpenGL is set up before plotting, ng ("nice graph") sets desired figure properties after plotting. For example, instead of:
opengl hardware % Set OpenGL to hardware
figure % Create figure
hPlot(1) = plot(rand(10,1),rand(10,1));
hold on
hPlot(2) = plot(rand(10,1),rand(10,1));
hPlot(3) = scatter(rand(10,1),rand(10,1));
hText(1) = title('Important Data');
hText(2) = ylabel('Effect, mag');
hText(3) = xlabel('Time, S');
hText(4) = legend('Stuff happening', 'Shit happening', 'Awesome scatter');;
hText(4).Location='NorthWest'; % Set legend location
set(hText, 'FontSize', 12) % Set all text handles to 12 pt in one command
hText(1).FontSize=14; % Set FontSize for single handle with . notation
a=gca; % Get handle of current axis
a.FontWeight = 'bold'; % Set all text to bold
a.LineWidth=1.25; % Make lines wider
set(hPlot, 'LineWidth', 1.4') % Set LineWidths for both plotted lines
hPlot(3).SizeData=50; % Set size of scatter points
hPlot(3).MarkerFaceColor=hPlot(3).CData; % Set fill colour of scatter points
f=gcf; % Get handle of figure
f.Position=[1 1 800 600]; % Increase size
grid % Turn major grid lines on
Note above how single handles can now be set with the structure .notation, and the same property for multiple handles of the same type can be set in one go using set (as pre-2014b).
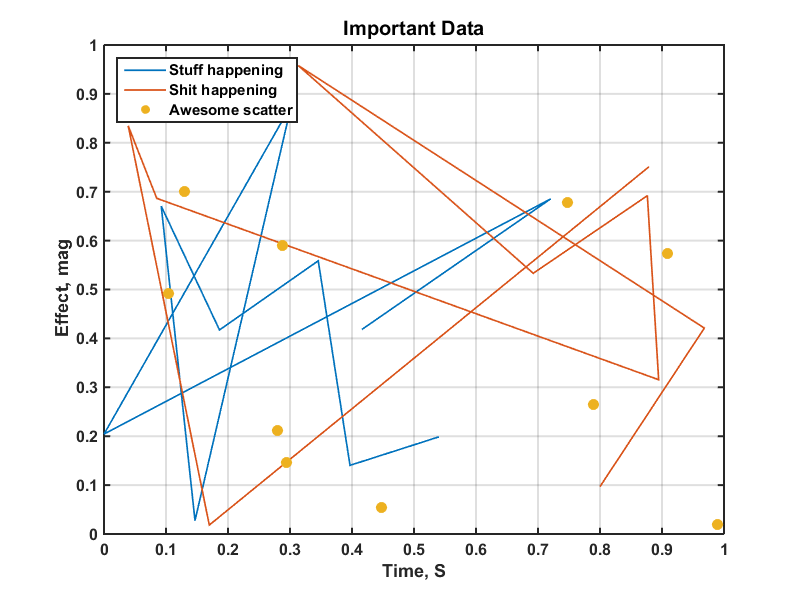
This code would do the same thing...
This code would do the same thing...
og % Check on OpenGL and set to hardware, if not already set
plot(rand(10,1),rand(10,1));
hold on
plot(rand(10,1),rand(10,1));
scatter(rand(10,1),rand(10,1));
title('Important Data');
ylabel('Effect, mag');
xlabel('Time, S');
legend('Stuff happening', 'Shit happening', 'Awesome scatter');
ng % Set default template (as per code above)
hold on
plot(rand(10,1),rand(10,1));
scatter(rand(10,1),rand(10,1));
title('Important Data');
ylabel('Effect, mag');
xlabel('Time, S');
legend('Stuff happening', 'Shit happening', 'Awesome scatter');
ng % Set default template (as per code above)
More details on how both functions work are below...
og checks the current status of the OpenGL renderer and attempts to set it to hardware before plotting. It provides examples of:
- Managing OpenGL
- Using try and catch to deal with potential errors/crashses
function og
%% Try and set openGL settings
% Is openGL available? Returns 1 if available
H = opengl('INFO');
The commands opengl info or opengl('info') on their own, return the current details of the OpenGL configuration to the command line. When an output variable (H here) is specified, rather than returning all the details seen in the command line, it simply returns a 1 if OpenGL is available, or a 0 if it isn't. Which is checked on the next line...
The commands opengl info or opengl('info') on their own, return the current details of the OpenGL configuration to the command line. When an output variable (H here) is specified, rather than returning all the details seen in the command line, it simply returns a 1 if OpenGL is available, or a 0 if it isn't. Which is checked on the next line...
if H==1;
% Get information about OpenGL
D = opengl('data');
To get the information supplied to the command line using opengl info or opengl('info'), use opengl('data') with a output variable specified (D here). This returns a structure, where D.Software will equal 1 if OpenGL is not in hardware mode.
To get the information supplied to the command line using opengl info or opengl('info'), use opengl('data') with a output variable specified (D here). This returns a structure, where D.Software will equal 1 if OpenGL is not in hardware mode.
if D.Software==1 % In software mode
try
% Try and switch to hardware
opengl hardware
catch err
% Catch error, if switch fails (?)
disp(err)
end
end
If D.Software is 1 (ie. OpenGL not in hardware mode), the command opengl hardware is run. Note that I'm not actually sure what will happen if the command opengl hardware fails. It could give a warning and continue anyway, or it could stop execution of the function. I don't want the latter to happen, so use a try and catch statement to avoid the possibility entirely.
The code in the try section is executed, if an error occurs (the sort of error that would usually stop execution with a load of red text in the command line) then execution continues by running the catch section of code. The err after catch saves the details of the error in to the variable err. disp(err) then outputs this information to the command line, without stopping the function.
At this point an attempt to switch to hardware was made, but we don't know if it worked. So let's check with OpenGL again.
% Confirm switch worked
D = opengl('DATA');
if D.Software==1
% If not, warn and continue
disp('Warning: Unable to set OpenGL to hardware.')
else
disp('OpenGL set to hardware.')
end
The remainder of the code is the end of the "if H==1" statement, and is run if OpenGL is totally unavailable.
else
% H=0, openGL not available
disp('Warning: OpenGL unavailable.')
end
ng.m run-through
ng.m
ng should be run after the figure is plotted, it's designed to minimise typing. It sets properties specified for each bit of the figure (text such as legends, axis labels etc., individual plot lines, individual axes in subplots, etc.). It can be set up as required, but comes with a default template that does the basics, for example...

This script provides an example of
ng should be run after the figure is plotted, it's designed to minimise typing. It sets properties specified for each bit of the figure (text such as legends, axis labels etc., individual plot lines, individual axes in subplots, etc.). It can be set up as required, but comes with a default template that does the basics, for example...
ng
- Managing and finding handles and figures already created
- Setting handle and figure properties using the new syntax in Matlab 2014b onwards
- Using switch and case with strings (instead of if strcmp(x,'string') ... - less typing)
- Using cells to arrange code
function handles=ng(template)
if nargin==0
template='Defualt';
end
First the function checks if a template has been specified, if not, it defaults to "Default".
%% Set defaults
% Figure positions
fPos=[1 1 800 600];
% Axes fonts
aFontSize = 12;
aFontWeight='bold';
aTFSM=1.25; % (TitleFontSizeMultiplier)
% Axes lines
aLineWidth=1.5;
% Line (eg. as produced by PLOT) lines
lLineWidth=1.25;
% Scatter markers
scMarkerSize=60;
% Legend
lLoc = 'NorthWest';
lFontSize = 11;
lFontWeight = 'bold';
% Grid
gr = 1;
The above cell of code sets up the Default template, even if another has been specified. This means that specific changes to templates can be set in the next cell, without having to spell out redundant settings in each template.
The above cell of code sets up the Default template, even if another has been specified. This means that specific changes to templates can be set in the next cell, without having to spell out redundant settings in each template.
%% Re-set specific settings for template
switch template
case 'Defualt'
% Leave as is
case 'Wide'
% Change position to make figure wider
% Otherwise as default
fPos=[1 1 1200 600];
case '...' % Define new templates here
end
This cell defines templates. The only extra template here is "Wide", and the only difference is the size of the figure. Add your own here. Note that using switch and case instead of if, elseif, end is a convenient thing to do here. No need to use the strcmp function. It's also possible to add an otherwise after the last case, that will run if none of the cases are matched.
%% Figure
This cell will actually set the properties. First it has to find the handles of the current figure (as ng doesn't take them as an input)
This cell will actually set the properties. First it has to find the handles of the current figure (as ng doesn't take them as an input)
% Get current figure
f=gcf;
% Find bits in figure
handles=findobj(f);
Here the command f=gcf ("get current figure") returns the handle to the current figure and stores it in f. The command findobj(f) then finds all the object handles within this figure (every element; text, line, axis, is an "object" and has its own handle). The handles are stored in a variable called handles and then a for loop runs through and sets the properties as per the template. A switch and case is used again to check the type of each of the handles to avoid trying to set properties inappropriate for a handle type, which would result in an error.
Here the command f=gcf ("get current figure") returns the handle to the current figure and stores it in f. The command findobj(f) then finds all the object handles within this figure (every element; text, line, axis, is an "object" and has its own handle). The handles are stored in a variable called handles and then a for loop runs through and sets the properties as per the template. A switch and case is used again to check the type of each of the handles to avoid trying to set properties inappropriate for a handle type, which would result in an error.
% Run through these and set properties according to template
for i=1:length(handles)
switch handles(i).Type
case 'figure'
% Set size
handles(i).Position=fPos;
case 'axes'
handles(i).TitleFontSizeMultiplier=aTFSM;
handles(i).FontSize=aFontSize;
handles(i).LineWidth=aLineWidth;
handles(i).FontWeight=aFontWeight;
% Grid
if gr==1
grid(handles(i), 'On')
else
grid(handles(i), 'Off')
end
case 'line'
handles(i).LineWidth=lLineWidth;
case 'scatter'
handles(i).SizeData=scMarkerSize;
% Special case - not set in template. Fills markers.
handles(i).MarkerFaceColor=handles(i).CData;
case 'legend'
handles(i).FontSize=lFontSize;
handles(i).Location=lLoc;
handles(i).FontWeight=lFontWeight;
end
end
At the end of the function the handles variable, containing the handles found by ng is output. This can be stored for easy access. For example, say figHandles=ng is called for a graph were 'NorthWest' isn't the best location for the legend. Rather than having to create or edit a template, one line of code could be used to make the adjustment from the handles ng returns, without having to replot and keep track of the handles.
Obviously ng can't read minds, so it will take a little effort to set up as required, but the current default template provides a step towards making publication quality figures for basic graphs, and a framework to build on. Also remember to save figures as .png or .svg to avoid undoing all your hard work making them look pretty.
No comments:
Post a Comment